One of my favorite things to do as a designer is take boring tables and data and convert it into visual information graphics. I usually feature them on Instagram, but figured some would make sense as a post on the blog as well.
The Top Coffee Consuming Countries
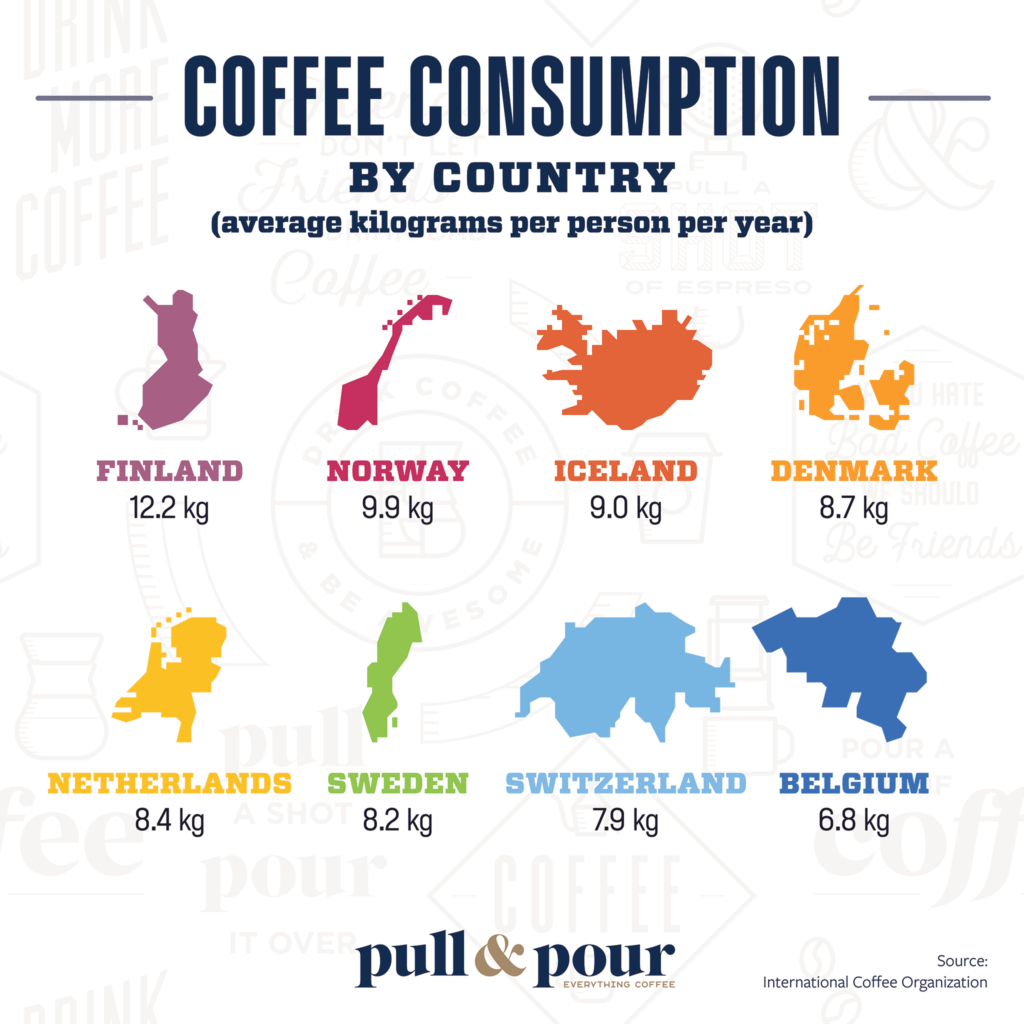
While I’d like to think Americans are the biggest lovers of coffee, it turns out we aren’t even in the top 10. Europe has us beat hands-down with their coffee consumption. Here are the top 10 coffee consuming countries:
| Country Name | Average Kilograms of Coffee Per Person, Per Year |
|---|---|
| Finland | 12.2 kg |
| Norway | 9.9 kg |
| Iceland | 9 kg |
| Denmark | 8.7 kg |
| Netherlands | 8.4 kg |
| Sweden | 8.2 kg |
| Switzerland | 7.9 kg |
| Belgium | 6.8 kg |
| Luxembourg | 6.5 kg |
| Canada | 6.2 kg |
Coffee Production by Country
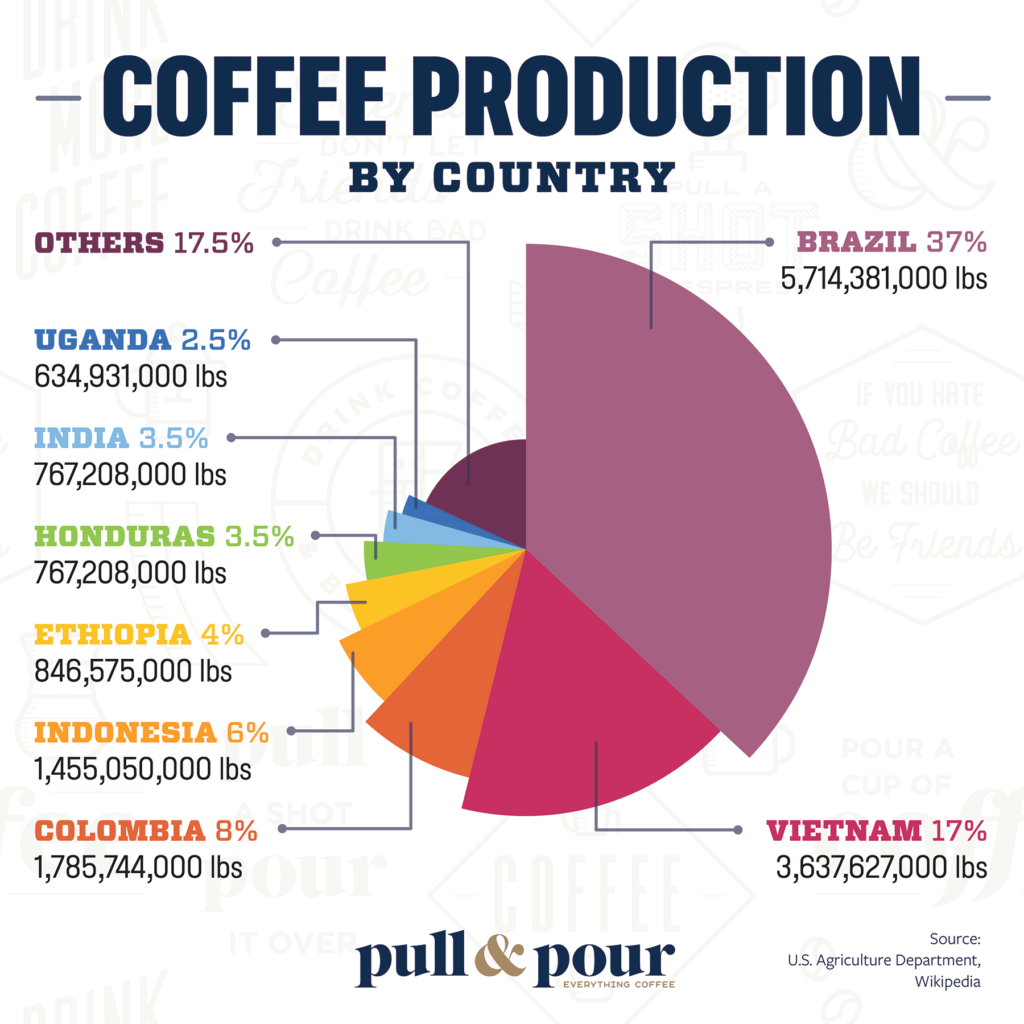
When it comes to coffee production by country, there were a few countries that didn’t surprise me, but others that I didn’t expect at all. For example, Vietnam is the second largest coffee producer in the world (thanks mostly to robusta beans). In the first graphic I break down coffee production by country (both arabica and robusta) and in the second graphic I isolate the arabica data, which aligns better with specialty coffee.
Arabica & Robusta Coffee Production by Country
| Country Name | Coffee Produced | Percentage |
|---|---|---|
| Brazil | 5,714,381,000 lbs | 37% |
| Vietnam | 3,637,627,000 lbs | 17% |
| Colombia | 1,785,744,000 lbs | 8% |
| Indonesia | 1,455,050,000 lbs | 6% |
| Ethiopia | 846,575,000 lbs | 4% |
| Honduras | 767,208,000 lbs | 3.5% |
| India | 767,208,000 lbs | 3.5% |
| Uganda | 634,931,000 lbs | 2.5% |
| Other countries | — | 17.5% |
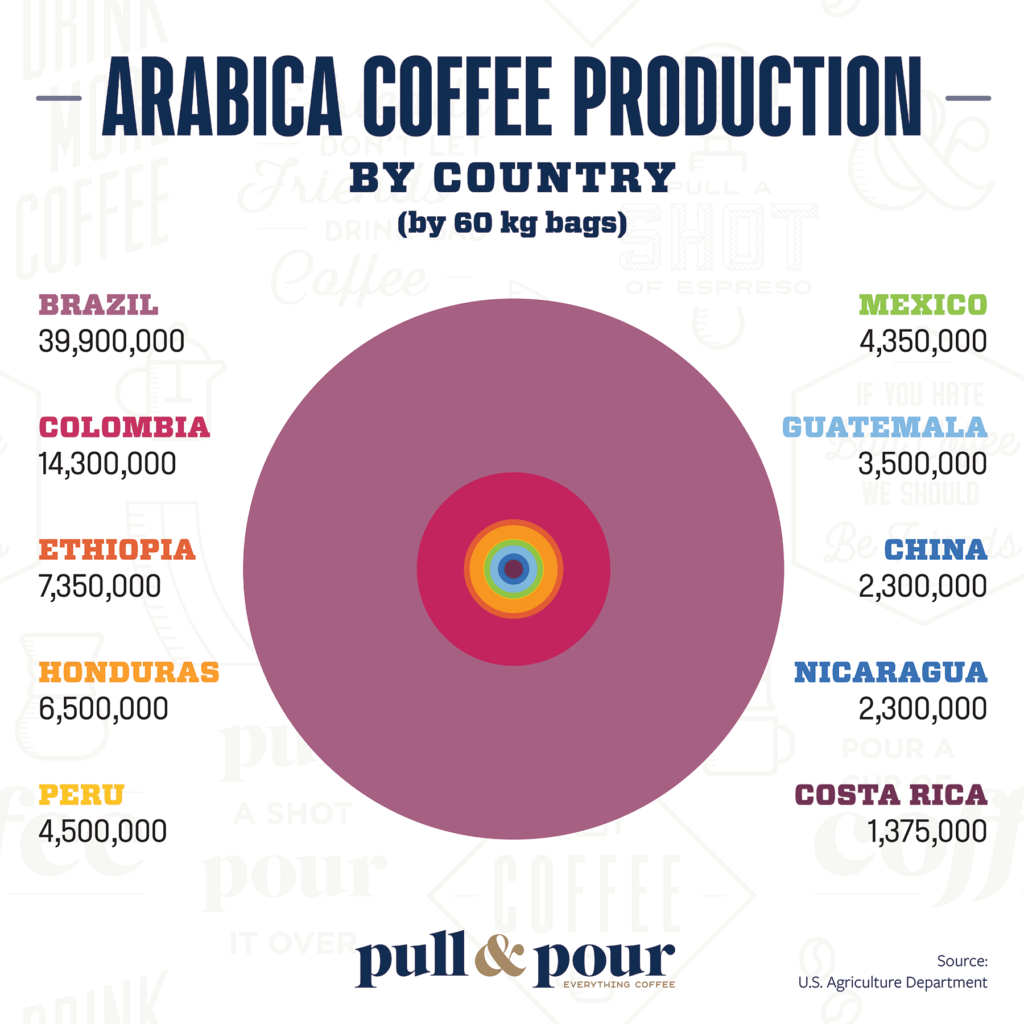
Arabica Coffee Production by Country
| Country Name | Coffee Produced (by 60 kg bags) |
|---|---|
| Brazil | 39,900,000 |
| Colombia | 14,300,000 |
| Ethiopia | 7,350,000 |
| Honduras | 6,500,000 |
| Peru | 4,500,000 |
| Mexico | 4,350,000 |
| Guatemala | 3,5000,000 |
| China | 2,300,000 |
| Nicaragua | 2,300,000 |
| Costa Rica | 1,375,000 |
